
Page 48 - PICE_ENG2014
P. 48
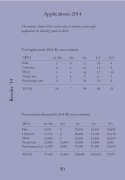
Applications 2014The statistics shown in this section relate to activities of successful applications for Mobility grants in 2014.Total applications 2014/By area-continentAREAFilmLiteratureMusicVisual Arts Performing ArtsAs.-Pac. Afr. Eu. LA NA3 0 4 03 0 4 6 4 111 19 4 15 13 418 17 10 17 4 3 29 15 4TOTAL 187906825Total amount allocated (€) 2014/By area-continentAREAFilmLiteratureMusicVisual Arts Performing ArtsAs.-Pac.8,555 17,155 14,000 12,400 15,300Afr. Eu. LA0 35,935 56,510 0 28,250 33,7000 36,800 41,050 14,000 51,000 10,800 2,000 76,500 47,100NA16,000 10,170 28,200 9,000 16,600TOTAL 67,41016,000 228,485189,160 79,97050Results ‘14
